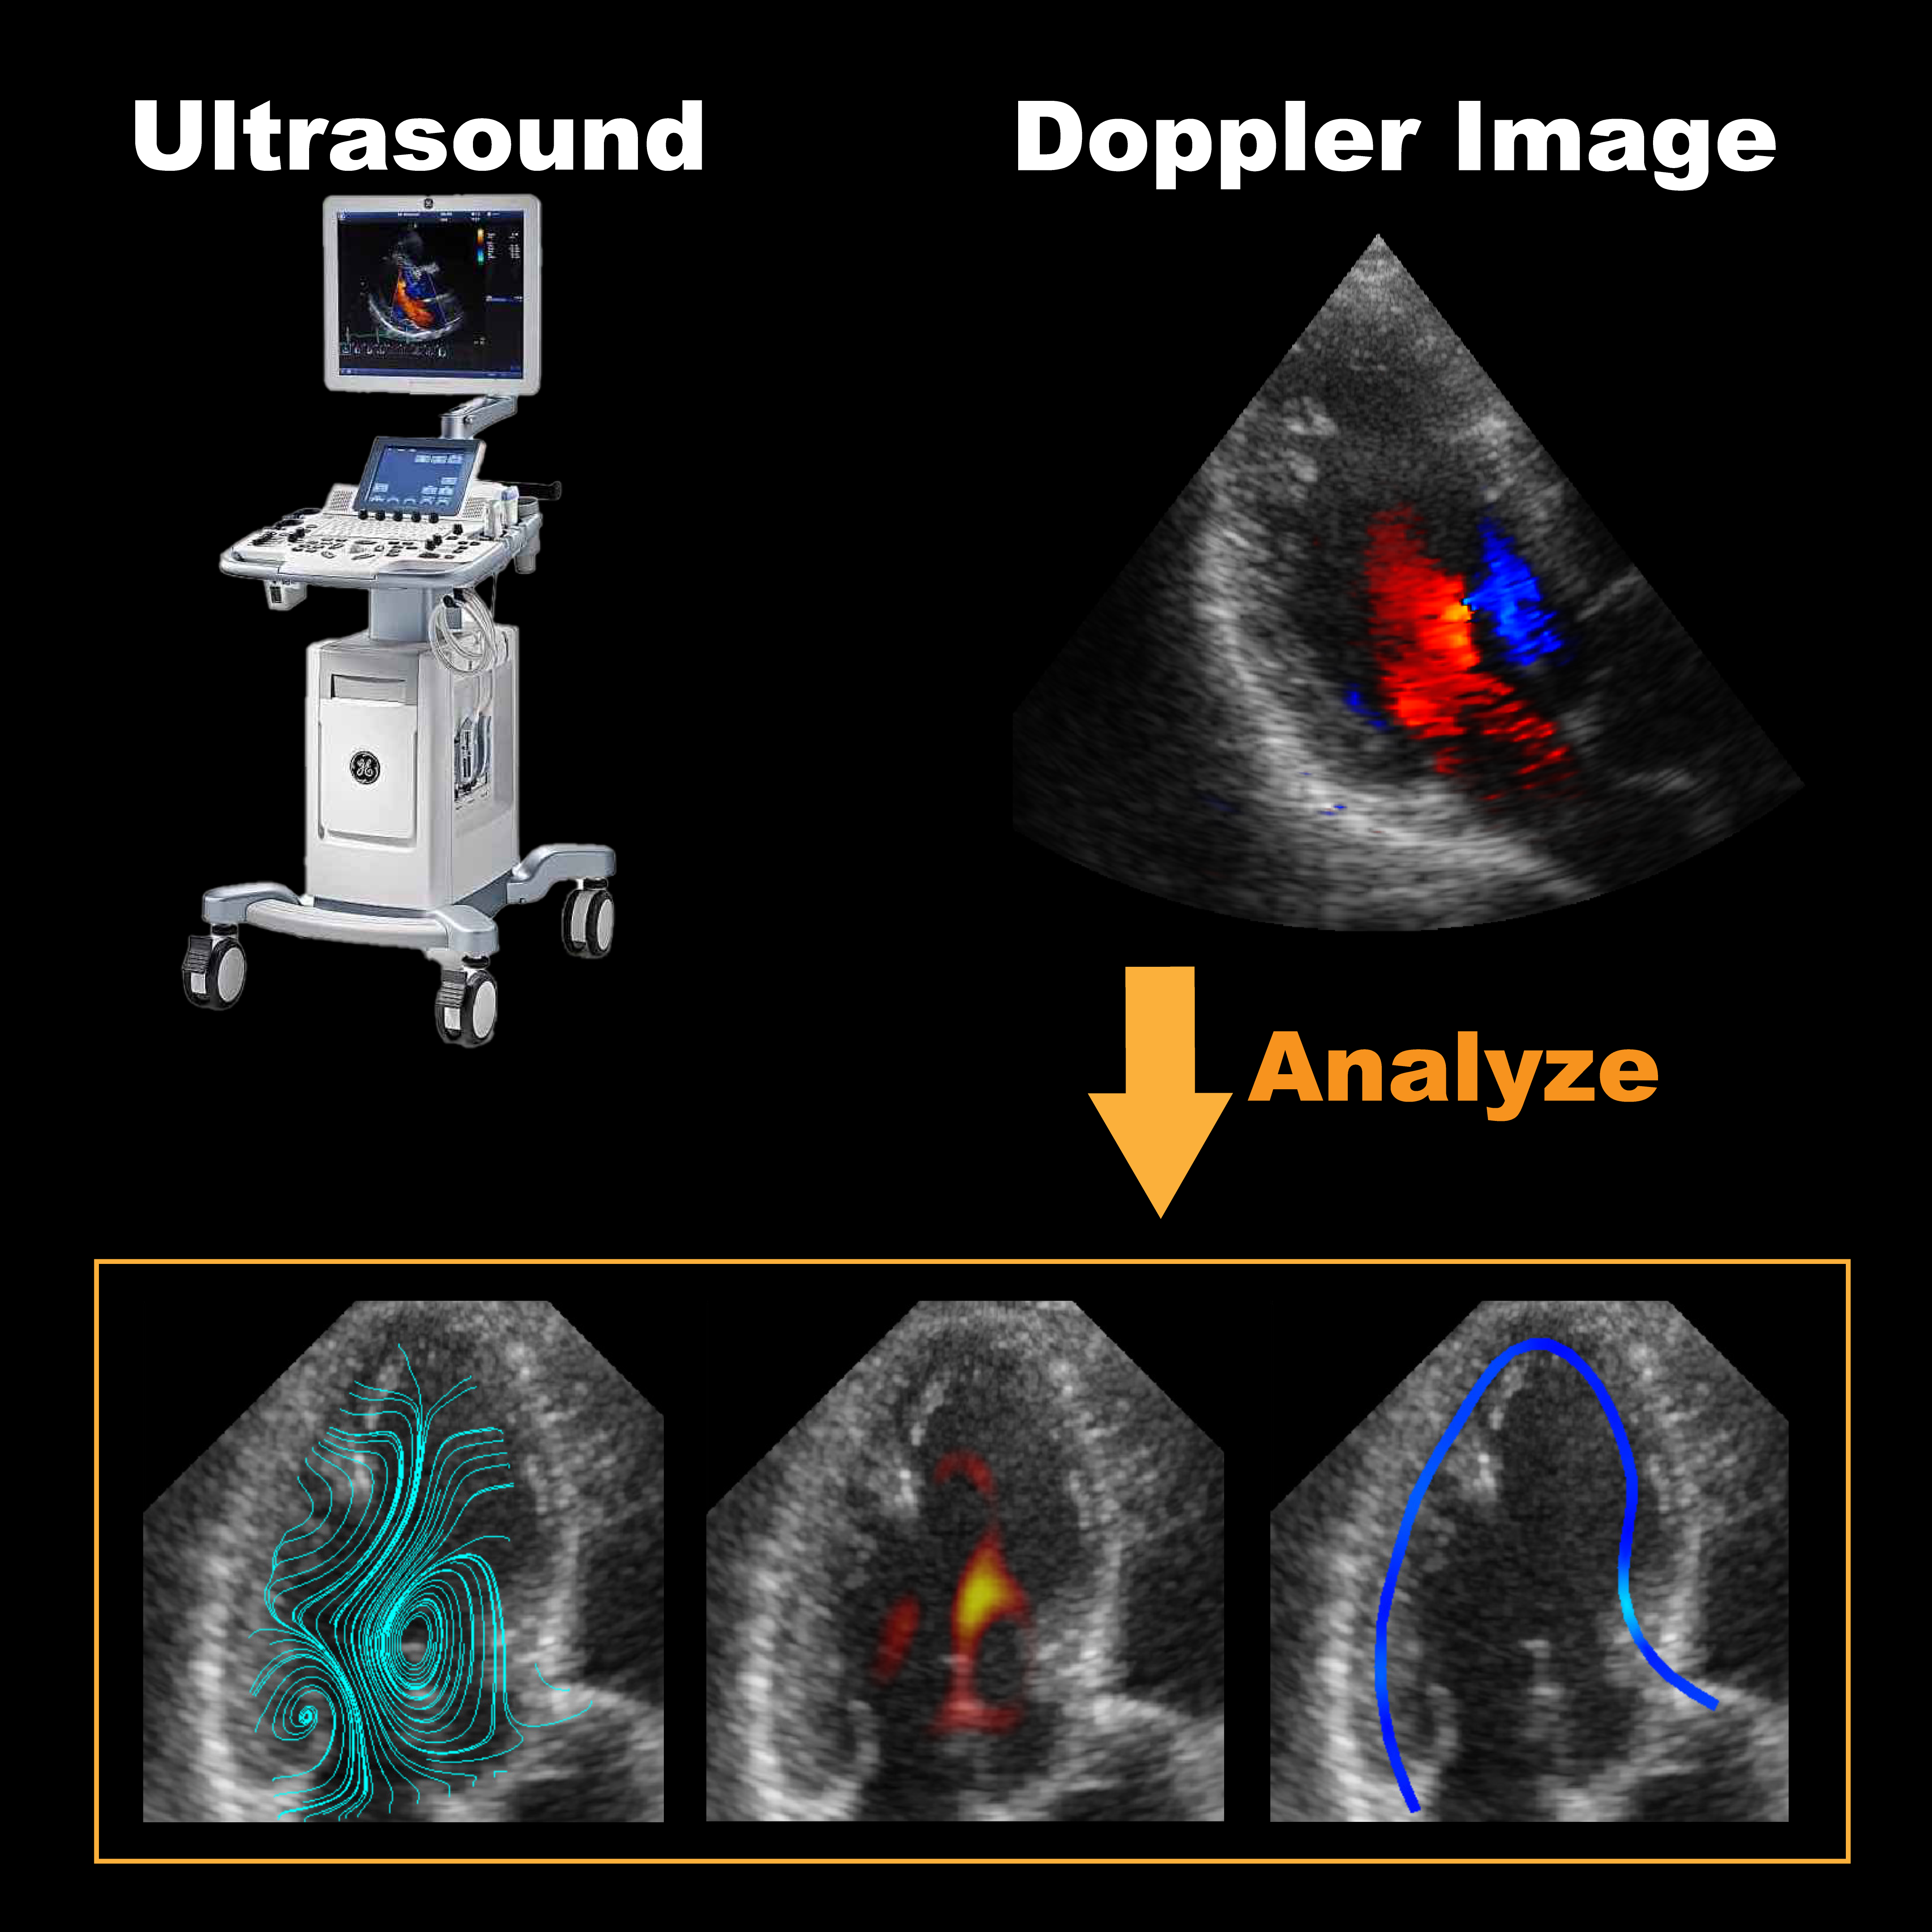
iTEcho® is a software bundle designed to analyze and visualize blood flow by using echocardiographic images on your own.
It is composed of two functions: VFM (vector flow mapping) and IVPD (intraventricular pressure difference).
This software bundle enables to evaluate velocity and pressure distributions in ventricles.
Features of iTEcho®
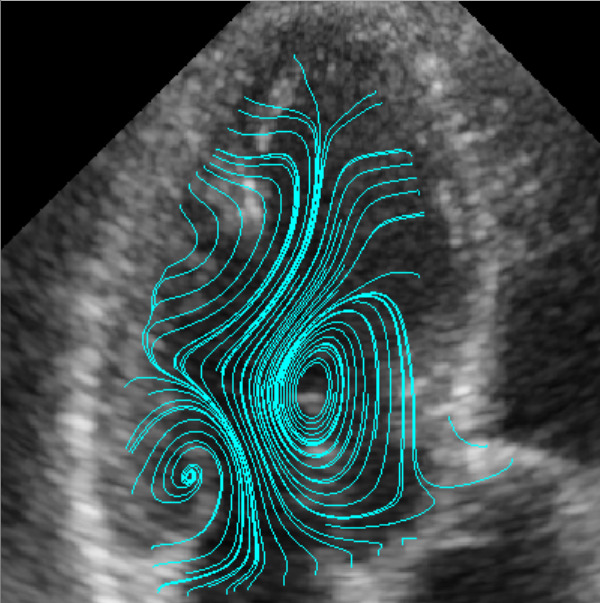
Visualize blood flow from a single image of echocardiography
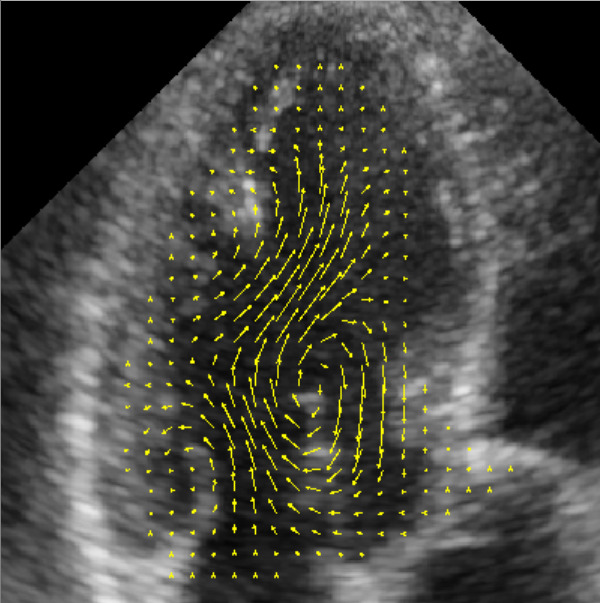
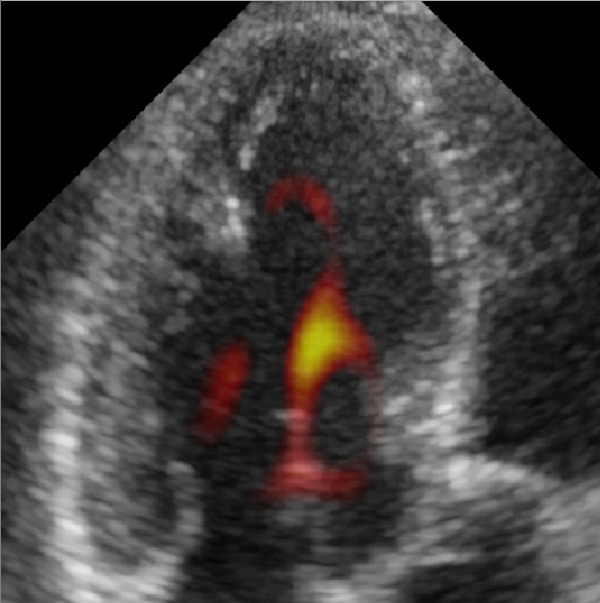
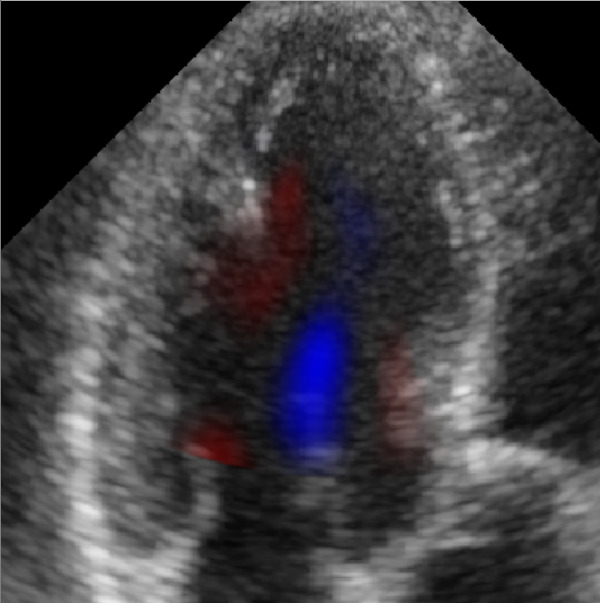
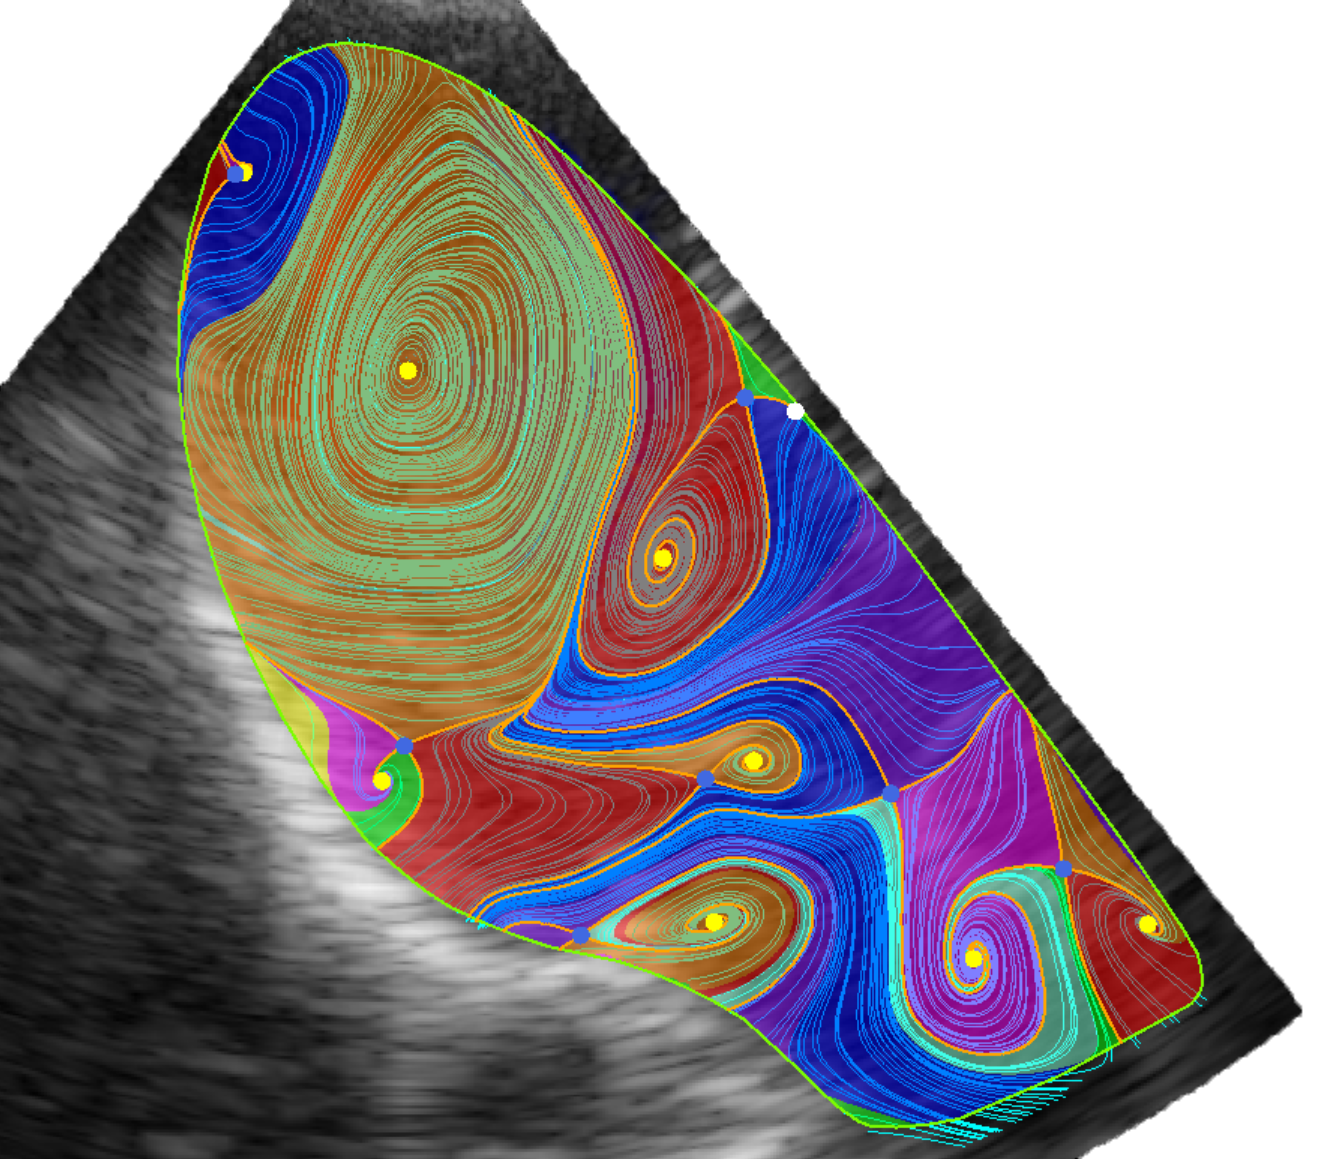
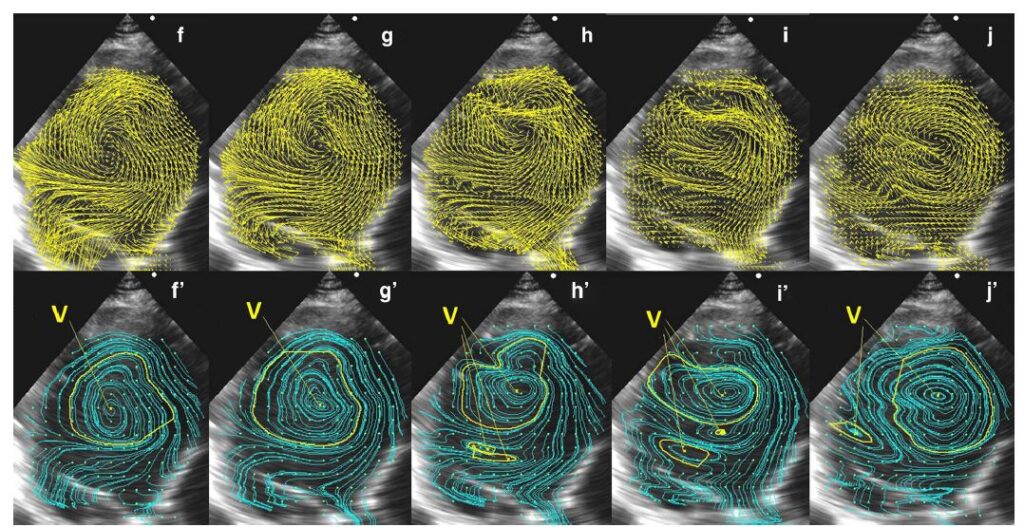
iTEcho® (VFM: vector flow mapping) is a tool to visualize and quantify blood flow. It shows velocity vectors from the apical long-axis view with a color Doppler image.
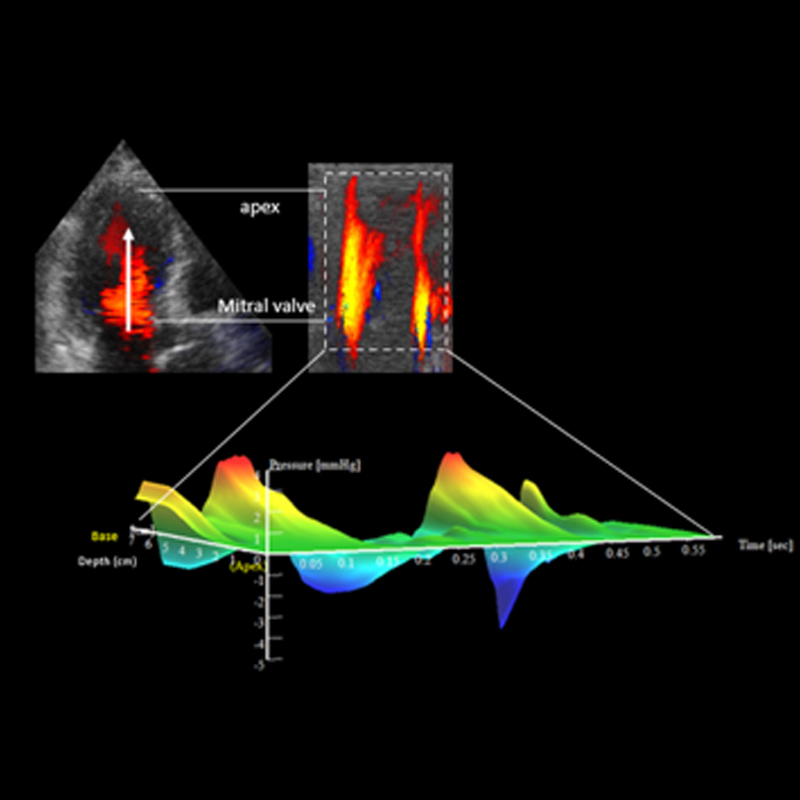
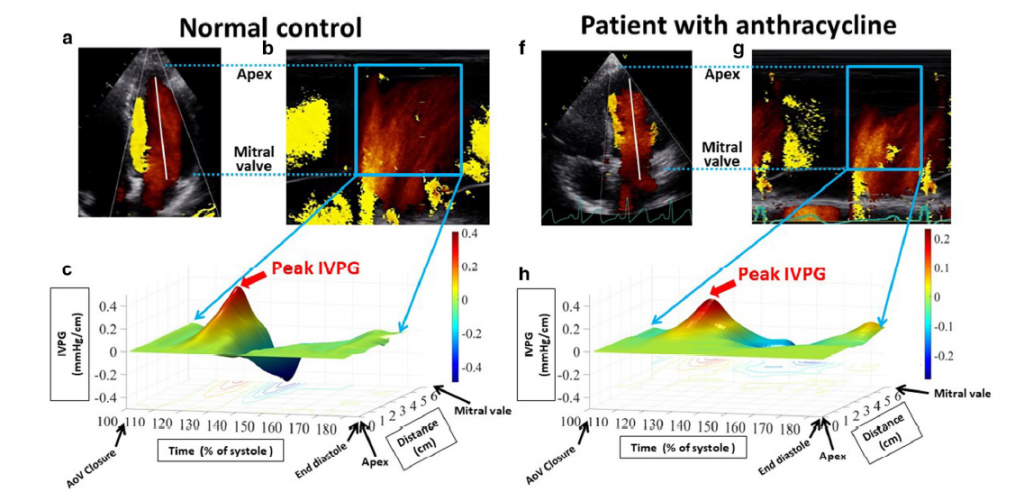
Visualize and quantify intraventricular pressure differences
iTEcho® can evaluate sucking force of the left ventricle with IVPD. The IVPD is calculated from color M-mode images of the left ventricle.
Visualized Parameters
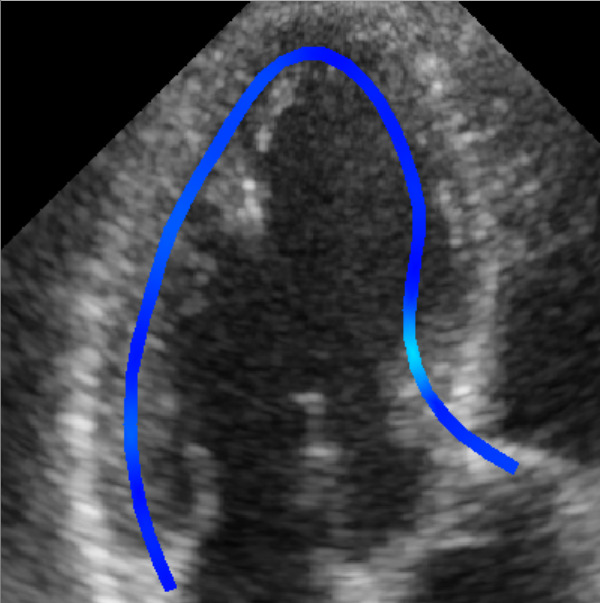
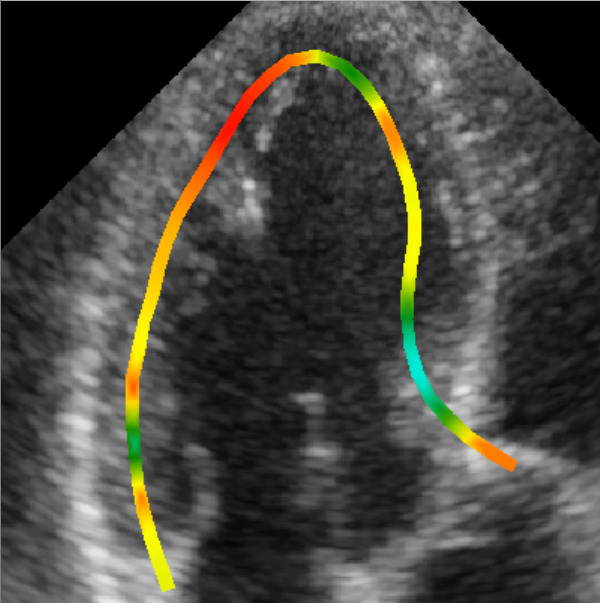
Velocity Vectors
Flow velocity vectors are calculated independently from the beam angle.
Can iTEcho® software be used with Echo VFM images from Canon Medical Systems?
iTEcho® is only available for analysis on GE Healthcare or Philips device.
Can iTEcho® use the Echo VFM software with Philips images?
Yes, iTEcho® supports both GE Healthcare and Philips image data.
What is the output format for sending iTEcho® analysis data to GateWay?
The output of the analysis results in iTEcho® is:
Still image: PNG
Video: Sequentially numbered PNG images and WMV, MPEG4
Graphs, etc.
Quantitative values: Text (CSV)
This is the basis of the system. As for the output format, we can modify it to fit your hospital's system, so please contact us for more information.