iTFlow

Request Quote
iTFlow is a software designed to analyze and visualize blood flow by using 4D Flow MRI images.

Clinical case


This is a case in which new information was obtained via iTFlow® about a problem in a patient with congenital heart disease that could not be detected by conventional testing. She was a patient with tetralogy of Fallot. As a nurse, she had shortness of breath during the night shift, which forced her to limit her work. Her encounter with Dr. Itatani and iTFlow® changed her life.

Testimonials


"We have been utilizing ITFlow for taking flow rate, wall shear stress, energy loss, and vorticity measurements. ITFlow has played a critical role in our analysis of customized aorta and RVPA graft implantation in porcine models." - Researcher at Children's National Hospital

Features of iTFlow

  • Heart motion tracking
    iTFlow has various tools embedded to help you segment several zones and process them very precisely with heart motion tracking.
  • User friendly interface
    User friendly interface
    Unlike most medical software, iTFlow has a comprehensive user interface with a ribbon like Microsoft Office.
    This aids you with a quicker workflow.
  • Configurable display
    Configurable display
    With iTFlow, you can display only the information you need to focus on.
    Show or hide some layers, the whole 2D or 3D view and even the ribbon menu!
    You can also select light or dark theme according to your preference.
  • Export your work
    Export your work
    When your work is done, you can export it to STL, video, image, VTK or DICOM file to connect easily with other software.
    You can also export the measurement result to a CSV file.

Visualized Parameters

  • Energy Loss
    Energy Loss
    iTFlow provides precise flow energy loss, a parameter of the cardiac workload.
  • Wall shear stress
    WSS(Wall Shear Stress)
    iTFlow provides WSS (wall shear stress), a measurement of mechanical stress on endothelial tissue.
  • Streamlines
    Streamline
    Streamlines are lines representing the direction of the blood flow showcasing flow acceleration or deceleration through color contrast.
    The structure of vortex flow or flow collision can also be visualized.
    Beneficial to visulaize flow characteristics at stenosed regions or near the valves
  • Pathlines
    Pathlines
    Pathlines enable the visualization of virtual blood particles. This function can be used to visulaize flow of particles with start points input by the user.
  • Helicity
    Helicity
    Helicity is the local strength of the helical motion of blood flow.
  • Vorticity
    Vorticity
    Vorticity is the local strength of the spinning motion of blood flow.
    Here, red represents clockwise flow and blue represents anti-clockwise flow
  • AFI
    AFI
    AFI (Aneurysm formation indicator) evaluates blood flow stagnation; AFI is an indicator proposed by Mantha et al. to detect zones of flow stagnation where the WSS vector aligns with endothelial cells during the cardiac cycle. The research team simulated the AFI of a para choroidal aneurysm by virtually removing the aneurysm and reconstructing the parent artery and reported that there are areas of relatively low WSS rotation or large negative AFI at the site of the aneurysm. (Mantha A, Karmonik C, Benndorf G, Strother C, Metcalfe R. Hemodynamics in a cerebral artery before and after the formation of aneurysm. Am J Neuroradiol. 2006; 27: 1113-8.)
  • OSI
    OSI
    OSI represents the temporal variation of WSS.
  • RRT
    RRT
    RRT (Relative residence time) represents the stagnation time of blood flow.
  • MotionTracking
                       
    Motion Tracking
    Spatial deformation of DICOM images (Cine, Magnitude, Phase Contrast) are calculated to recreate a 3D mask. Heartbeat motion is tracked over time during this step which enables measurements of time variations such as volumetrics.
  •                  PCA
    PCA
    PCA represents the intensity of the flow velocity obtained from MRI.
  • ValveTracking
    Valve Tracking
    Measurement of flow rate at the valve (and any other region of interest) is possible while incorporating contraction movements of the heart over time to visualize and quantify flow rate during the systolic or diastolic phase.
  • Vector
    Vector
    Visualization of blood flow vectors in 3D is possible.
  • Other measurement functions
    Ever-evolving functions
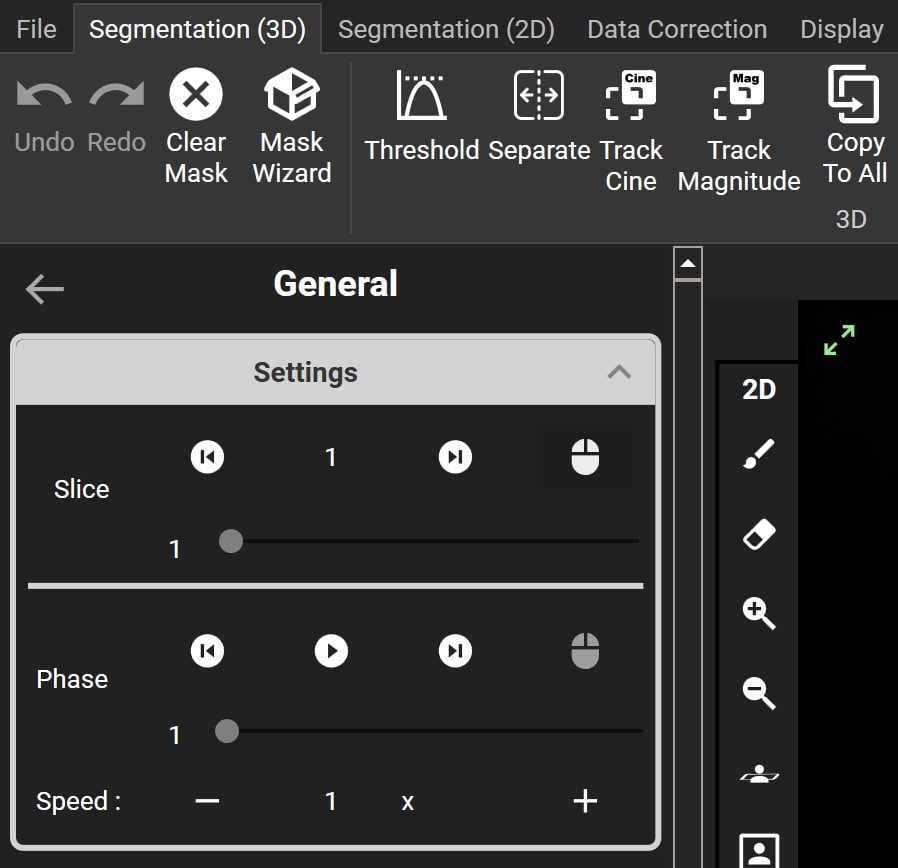
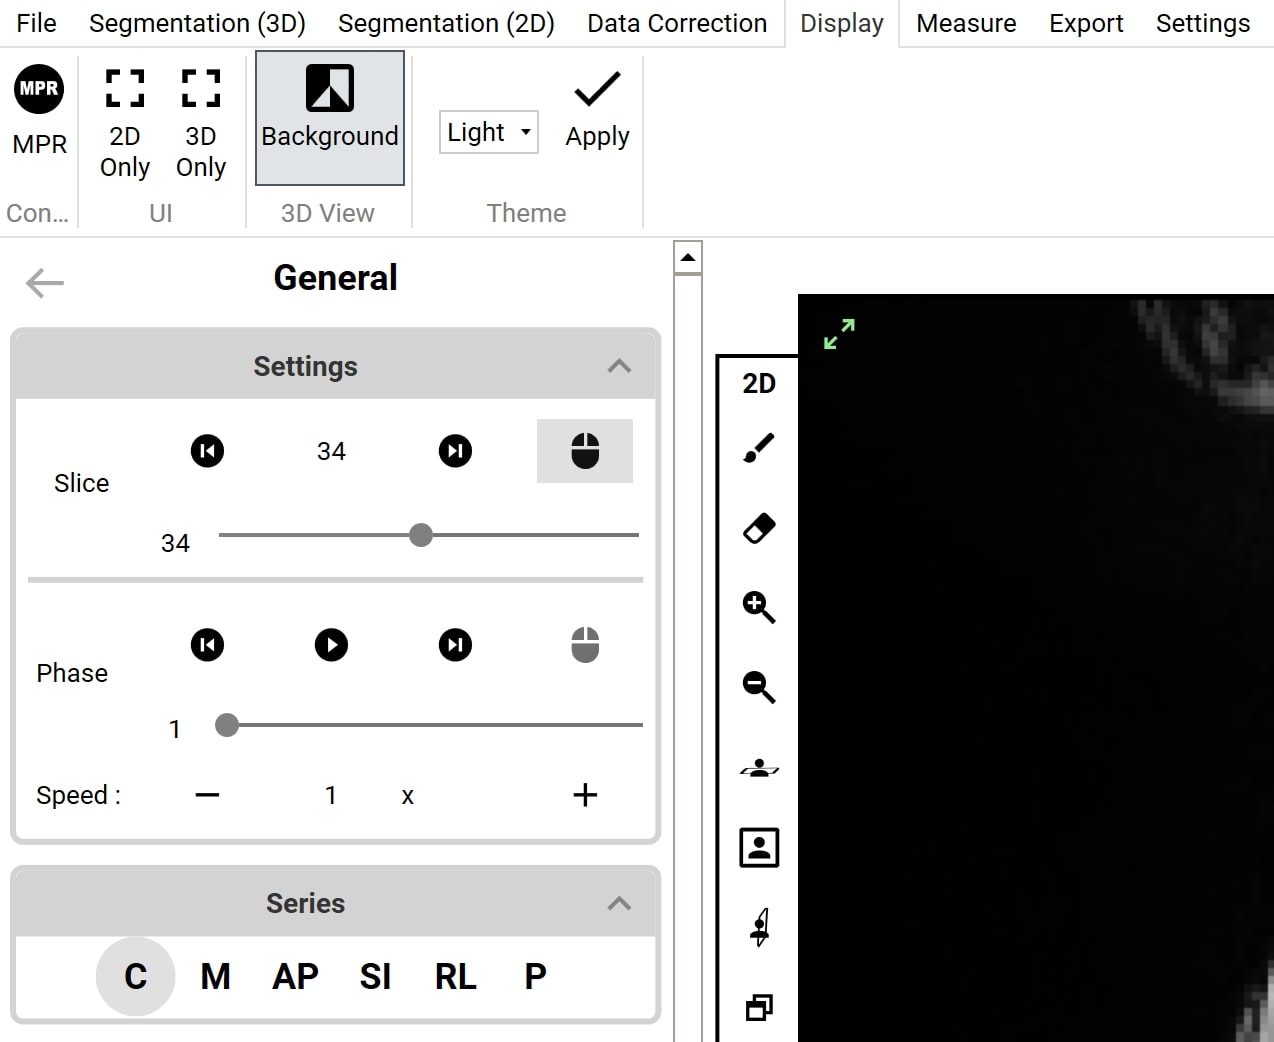
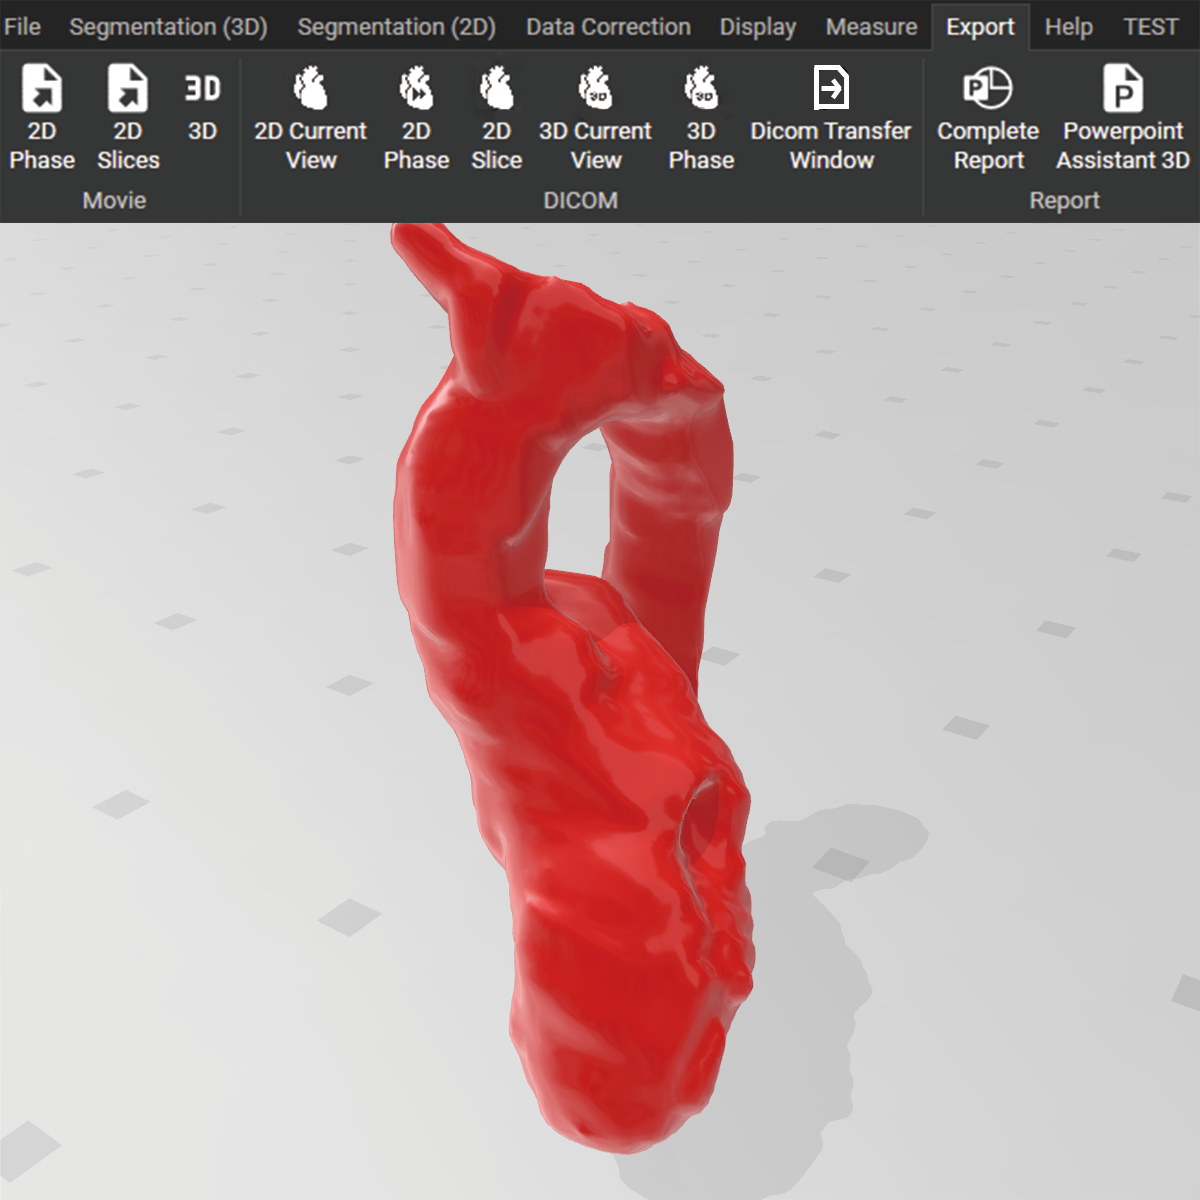
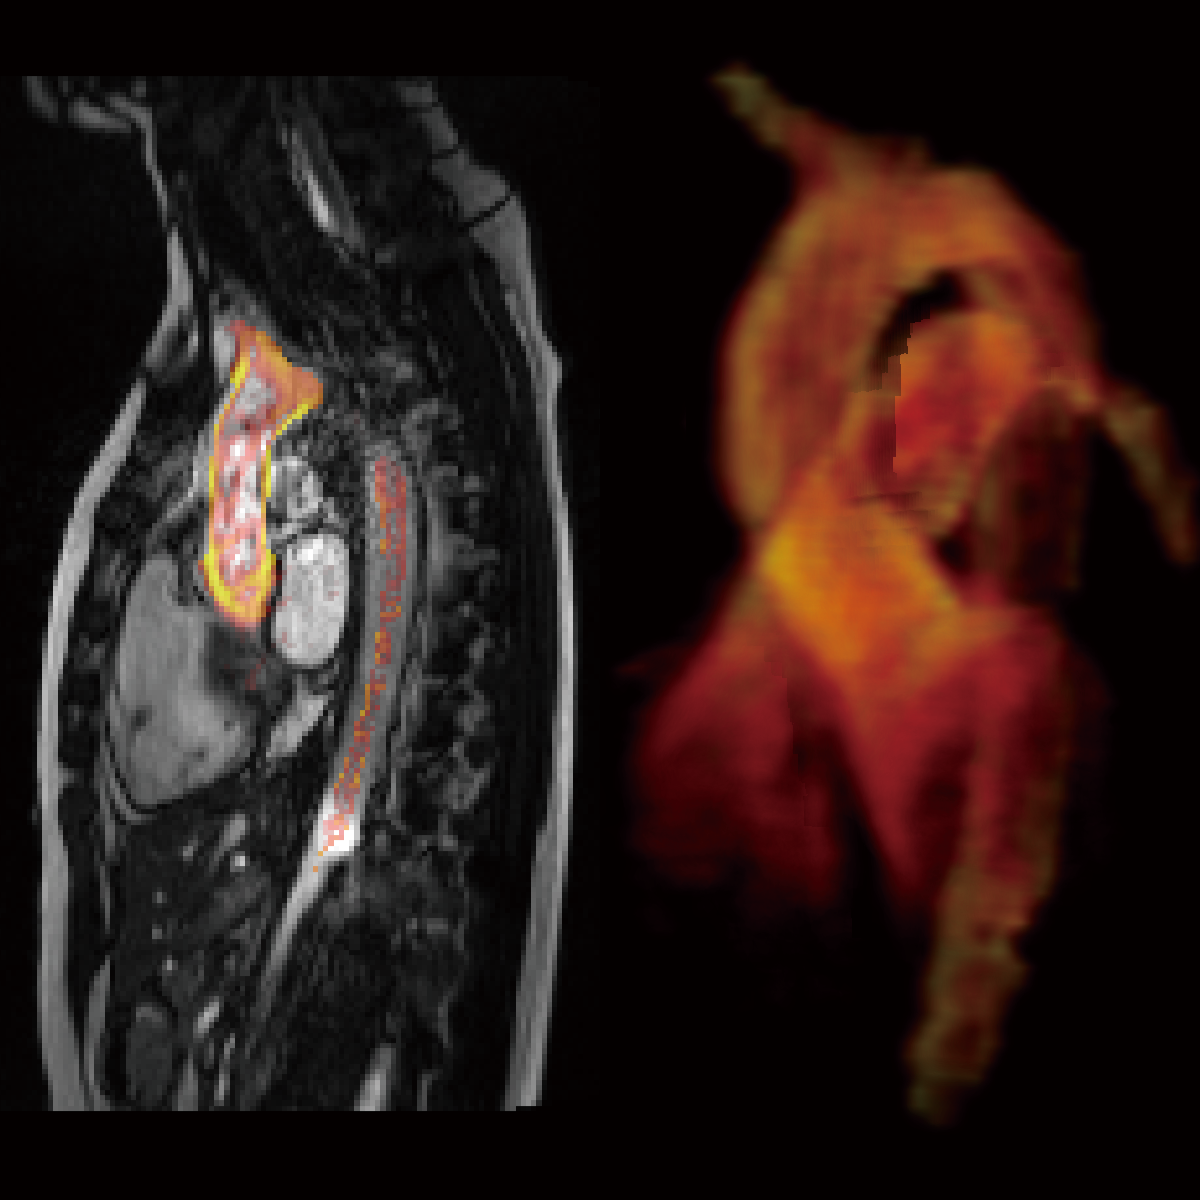
    Functions with iTFlow are evolving as per the needs of our clients.
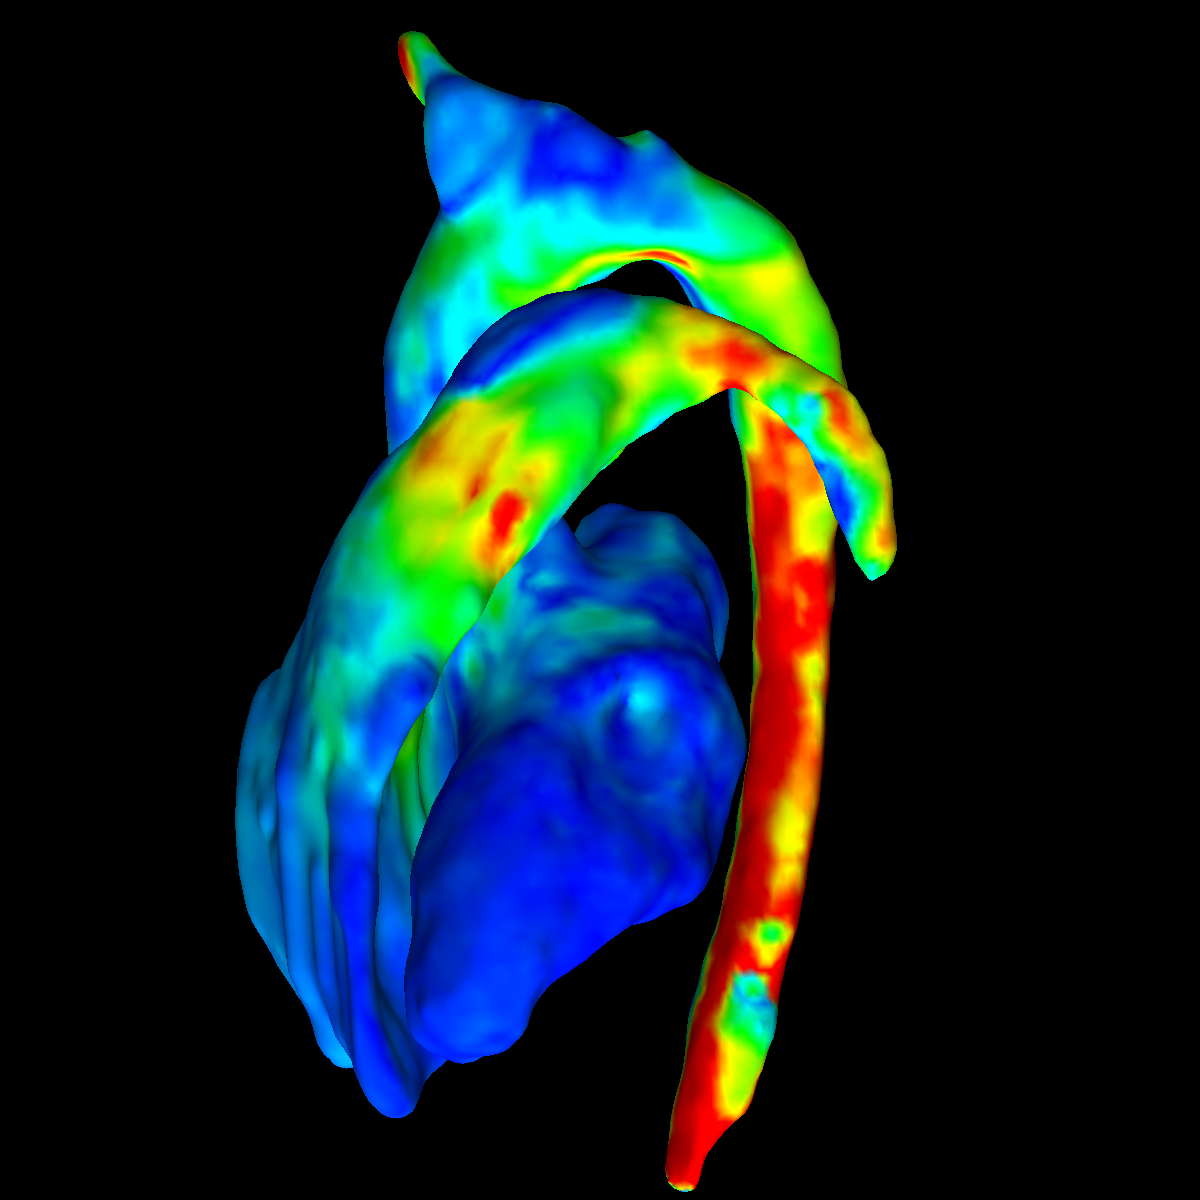
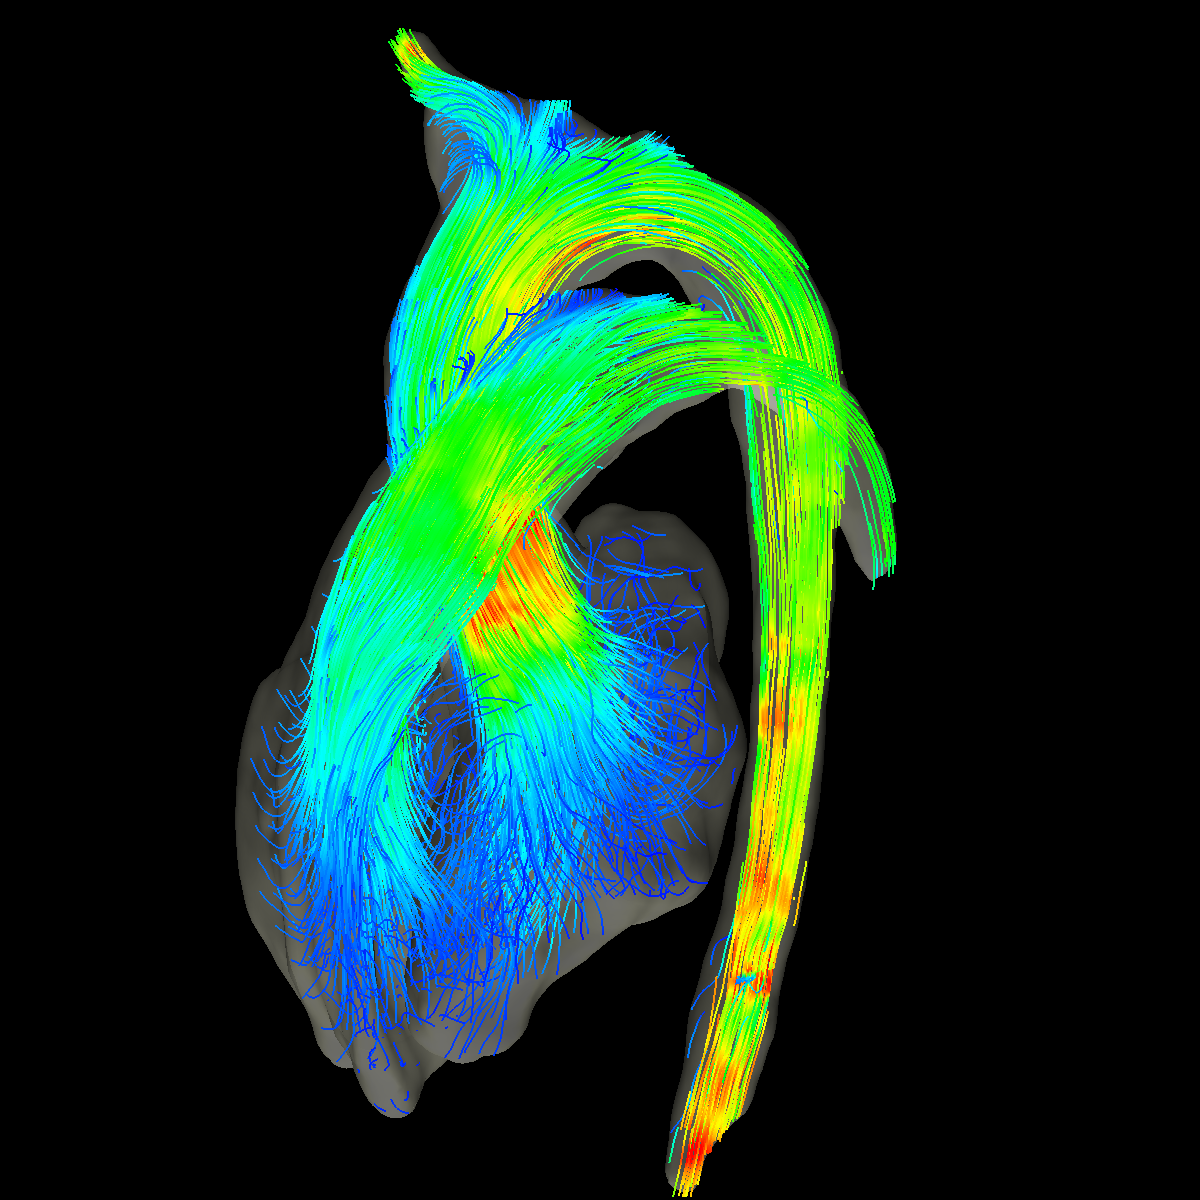
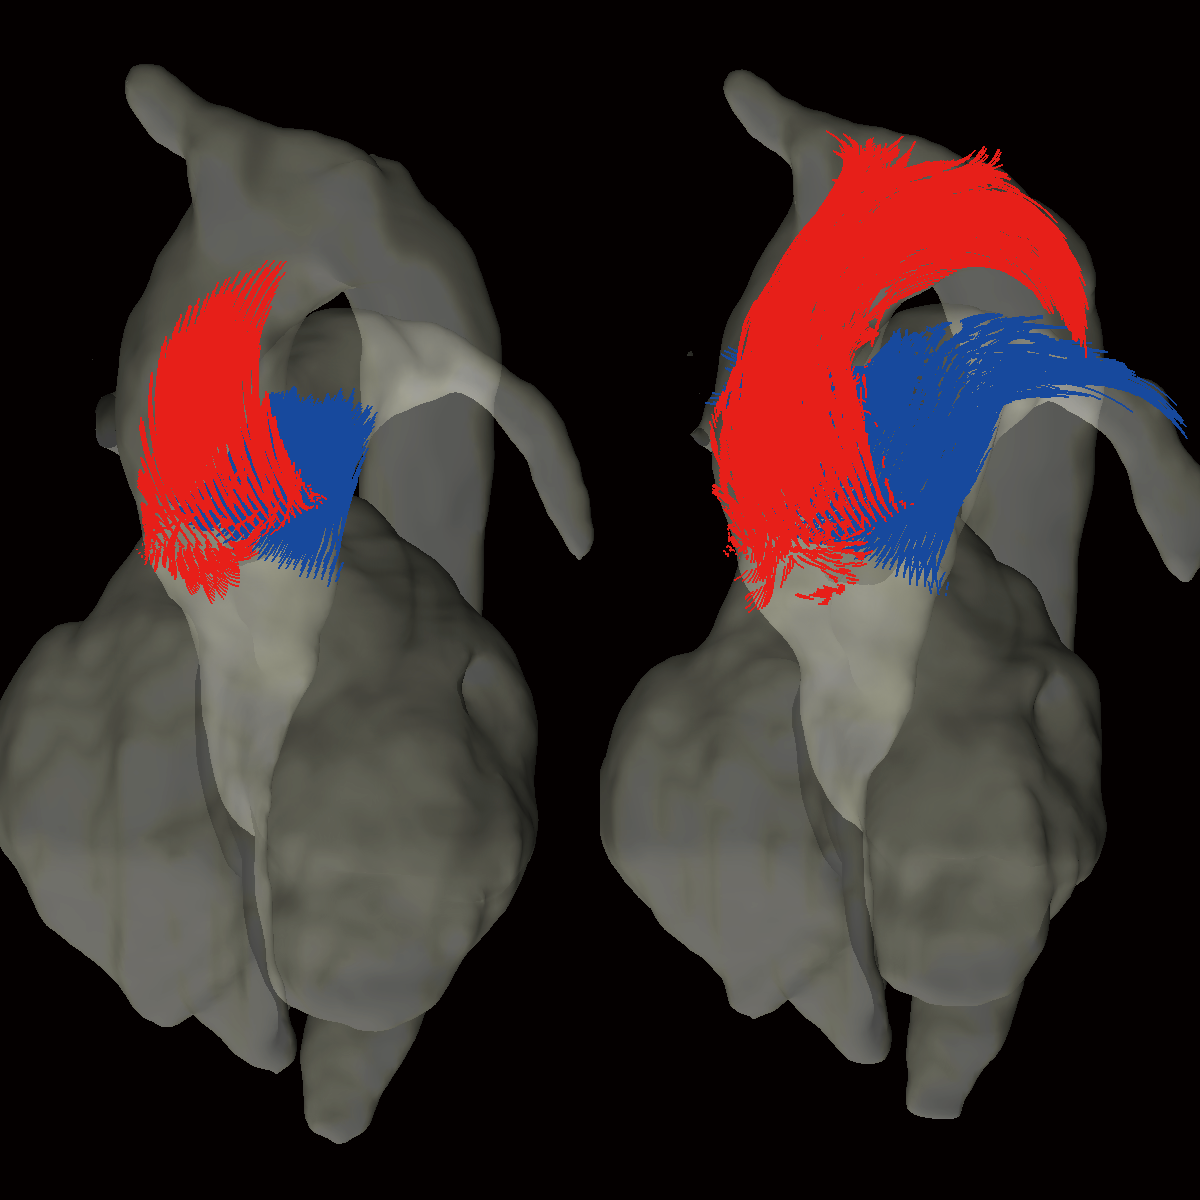
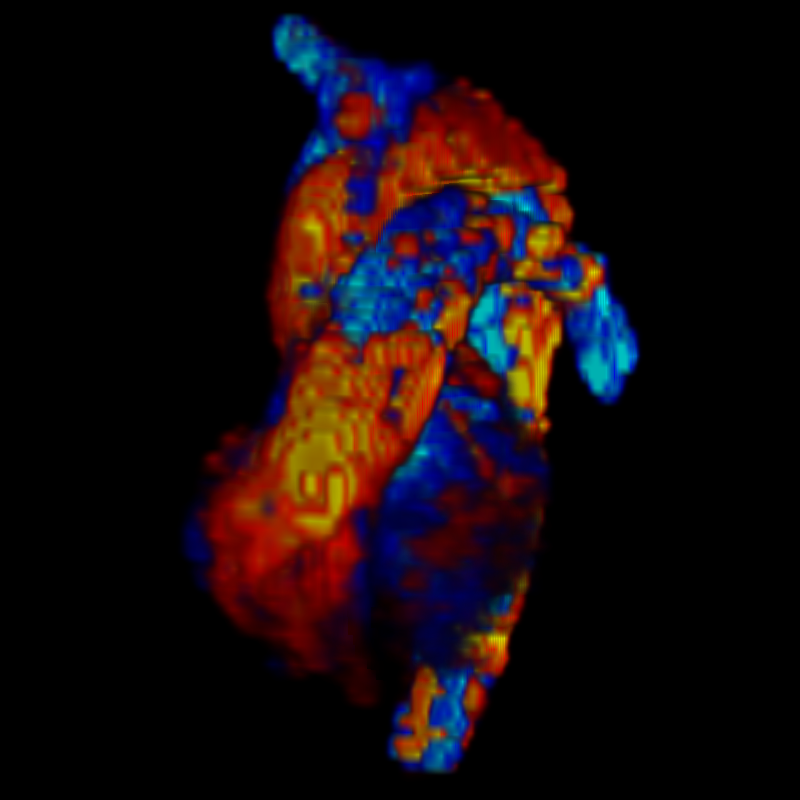
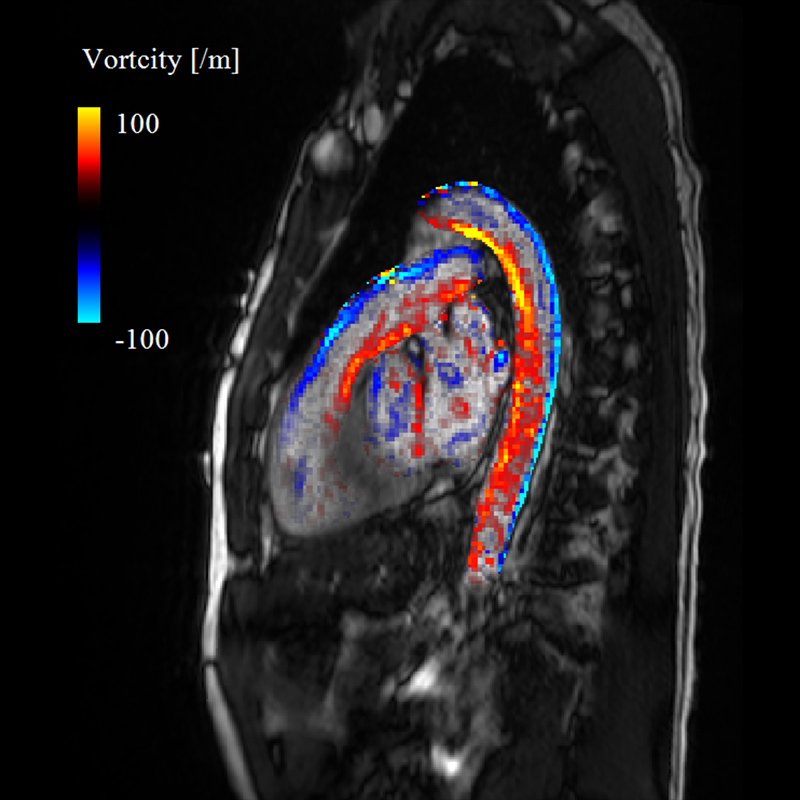
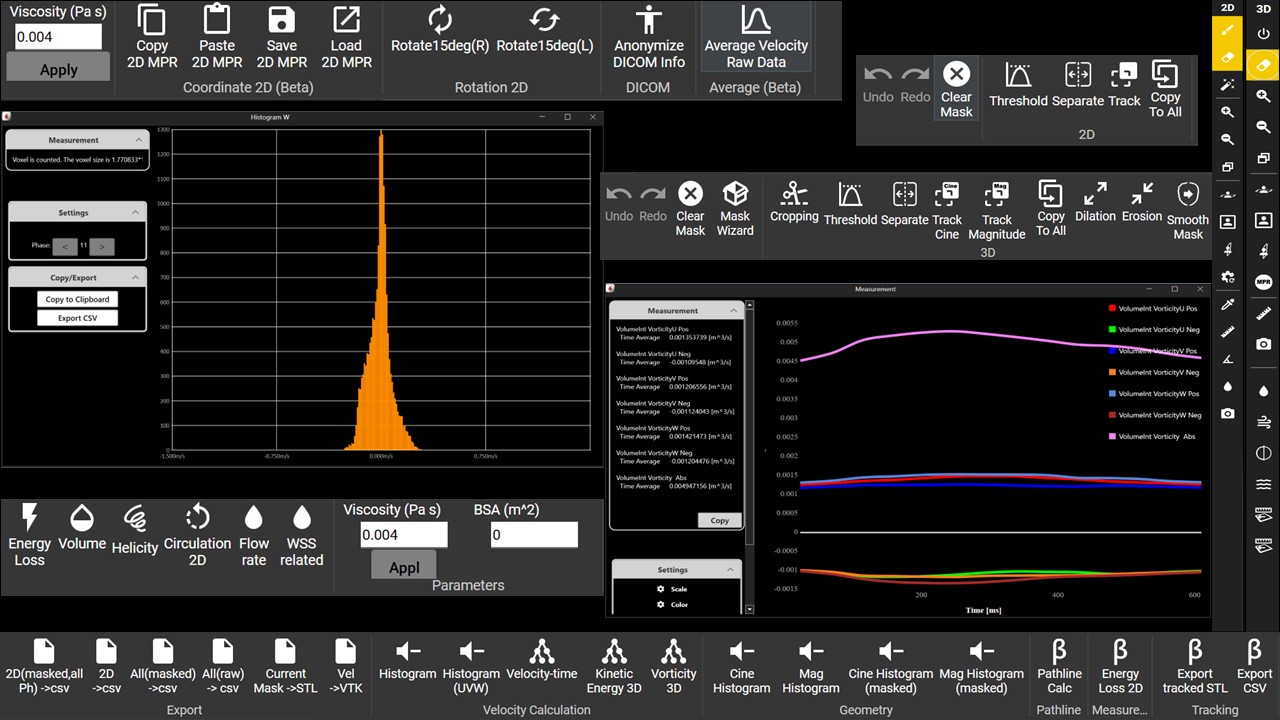
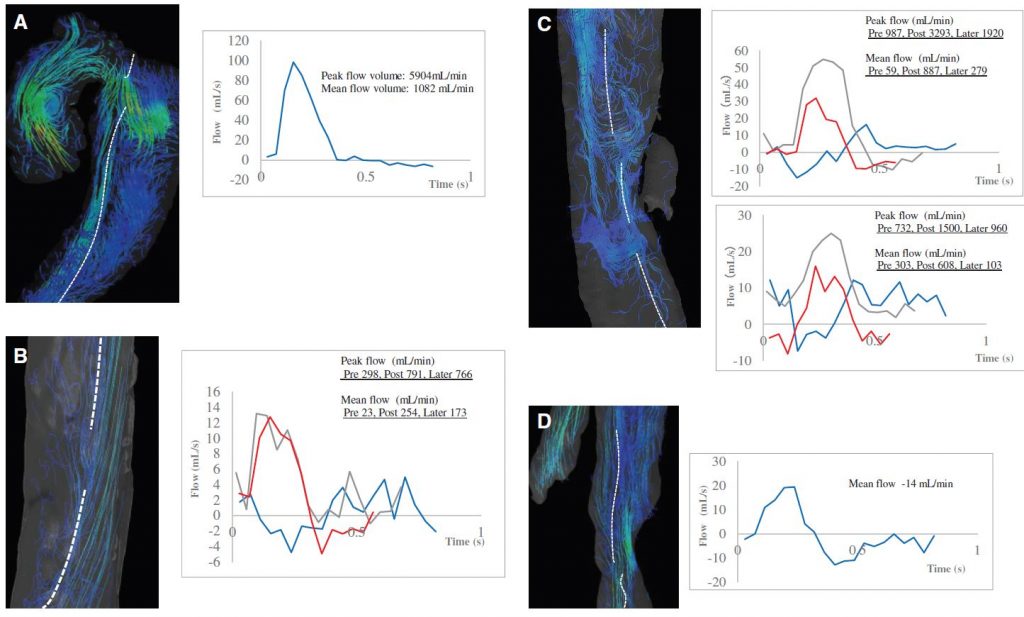
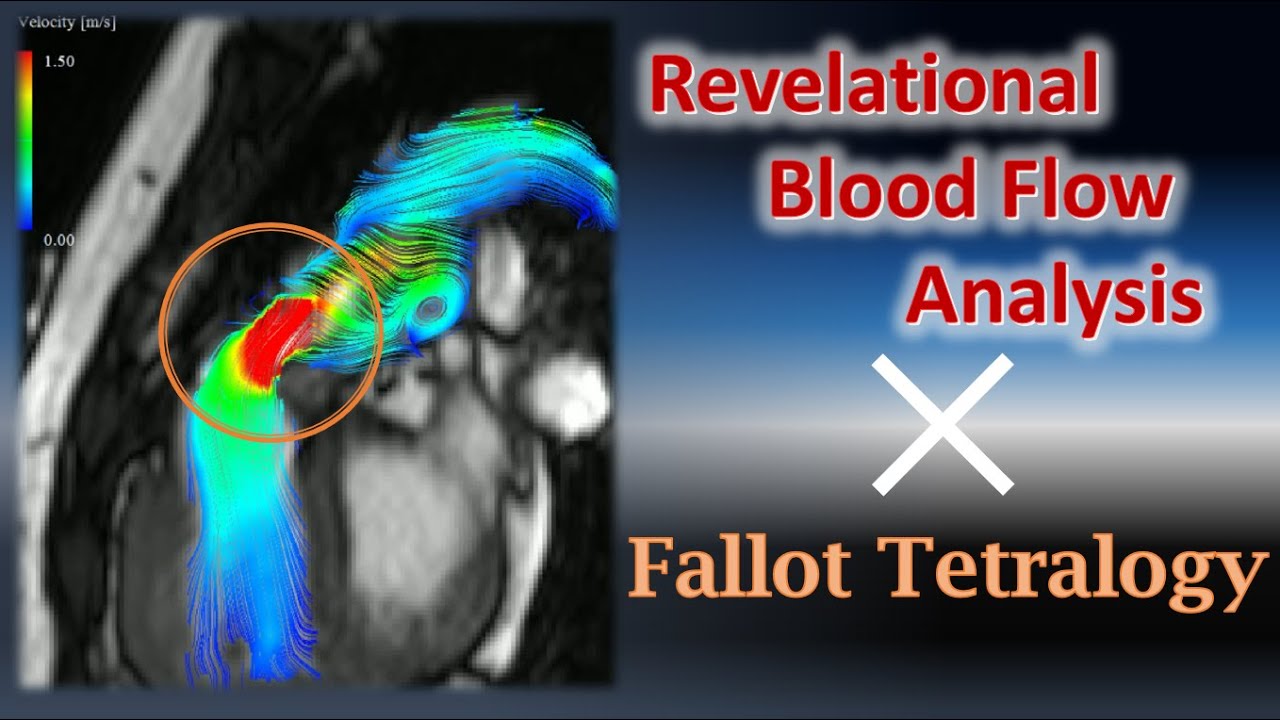
    Be it Threshold, separation, tracking, angle, distance, flow rate measurement, Velocity Histograms, or Vorticity 3D.
    There's much more that iTFlow can do for you. Find the one that's right for your needs.

Movies

Enabled Devices

We are compatible with most MRI devices that can capture 4D Flow MRI images.
Please feel free to contact us for further details at info@cfd.life.

Minimal Configuration

Recommended Configuration

Case Report

More Cases

FAQs

More Questions

Contact

If you would like to order or have any questions,
please let us know from the following contact form
Contact us
>