iTSimulation

Contact us
iTSimulation is a contract service that offers a simulation and visualization of blood flow based on CT images which you upload on our cloud storage. It is based on high-end computer technology and computational fluid dynamics (CFD). This service enables you to research computational medical problems easily with a report that we will provide to you. When combined with computer graphics (CG), "virtualized surgery" is also enabled.

Order Flow

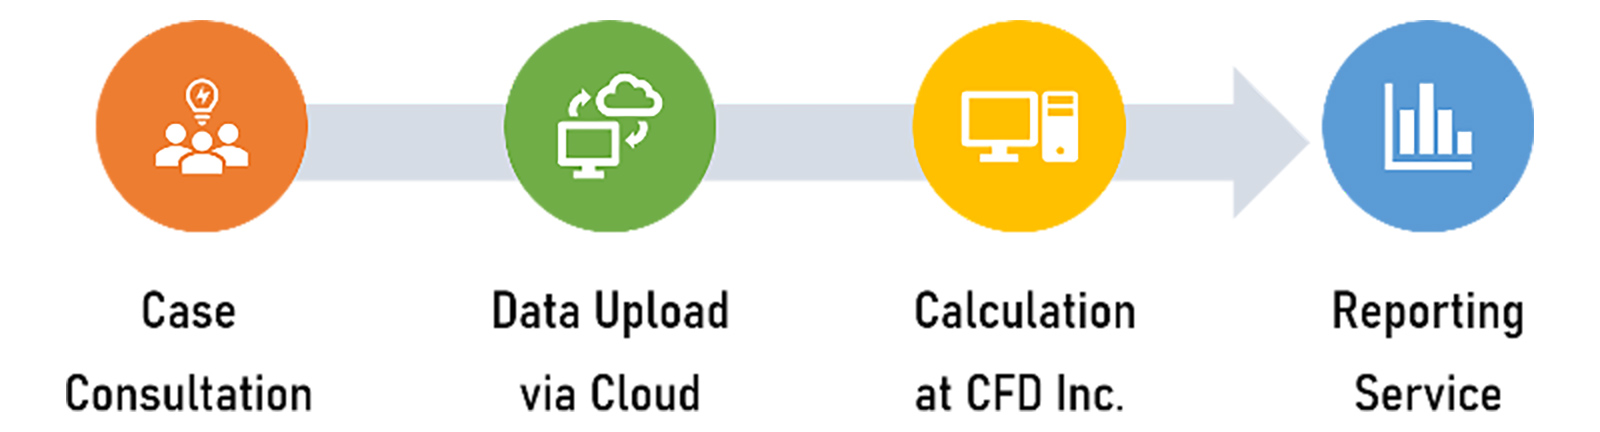
Researchers/clients can order iTSimulation service via the company’s e-mail as well as through the website https://cfd.life/en/contact. The order flow is divided into three steps to achieve the target with high quality by the deadline.
iTSimulation orderflow
  • Step1: Case/project consultation
    Researchers/clients contact Cardio Flow Design Inc. via text, email, and/or online meeting informing about the cases/projects. This process includes computerized virtual surgery for pre-post therapeutic simulation of hemodynamics. With computer graphics (CG), virtual surgery can be performed through discussion between engineers and clients, and in addition, physiological condition such as flow rate or pressure can be determined according to the clients’ requirement in our simulation system.
  • Step2: Data upload via cloud
    The medical images of computed tomography (CT)/magnetic resonance imaging (MRI) machines are required in digital imaging and communications in medicine (DICOM) format from researchers/clients. These DICOM images can be uploaded to our cloud via online service or a DVD posted to the company postal address. Once the data has been uploaded, 3D vascular geometry is created with CG and following final decisions regarding the hemodynamic conditions and virtual surgery geometry, simulation process proceeds.
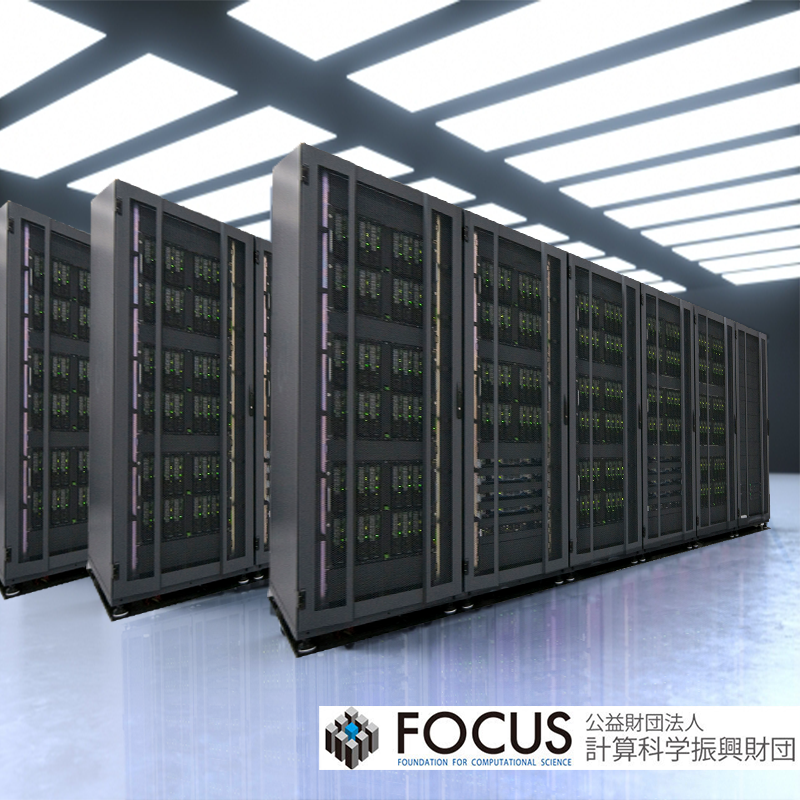
  • Step3: Calculation with supercomputer/tower PC
    Cardio Flow Design Inc. has its own system to realize physiological pulsatile flow by solving 3D Navier-Stokes equation using its own house-made code based on finite volume method. For high performance in simulation, high-spec supercomputer/tower PC is always running at full capacity. Clients may just need to wait for a couple of days.
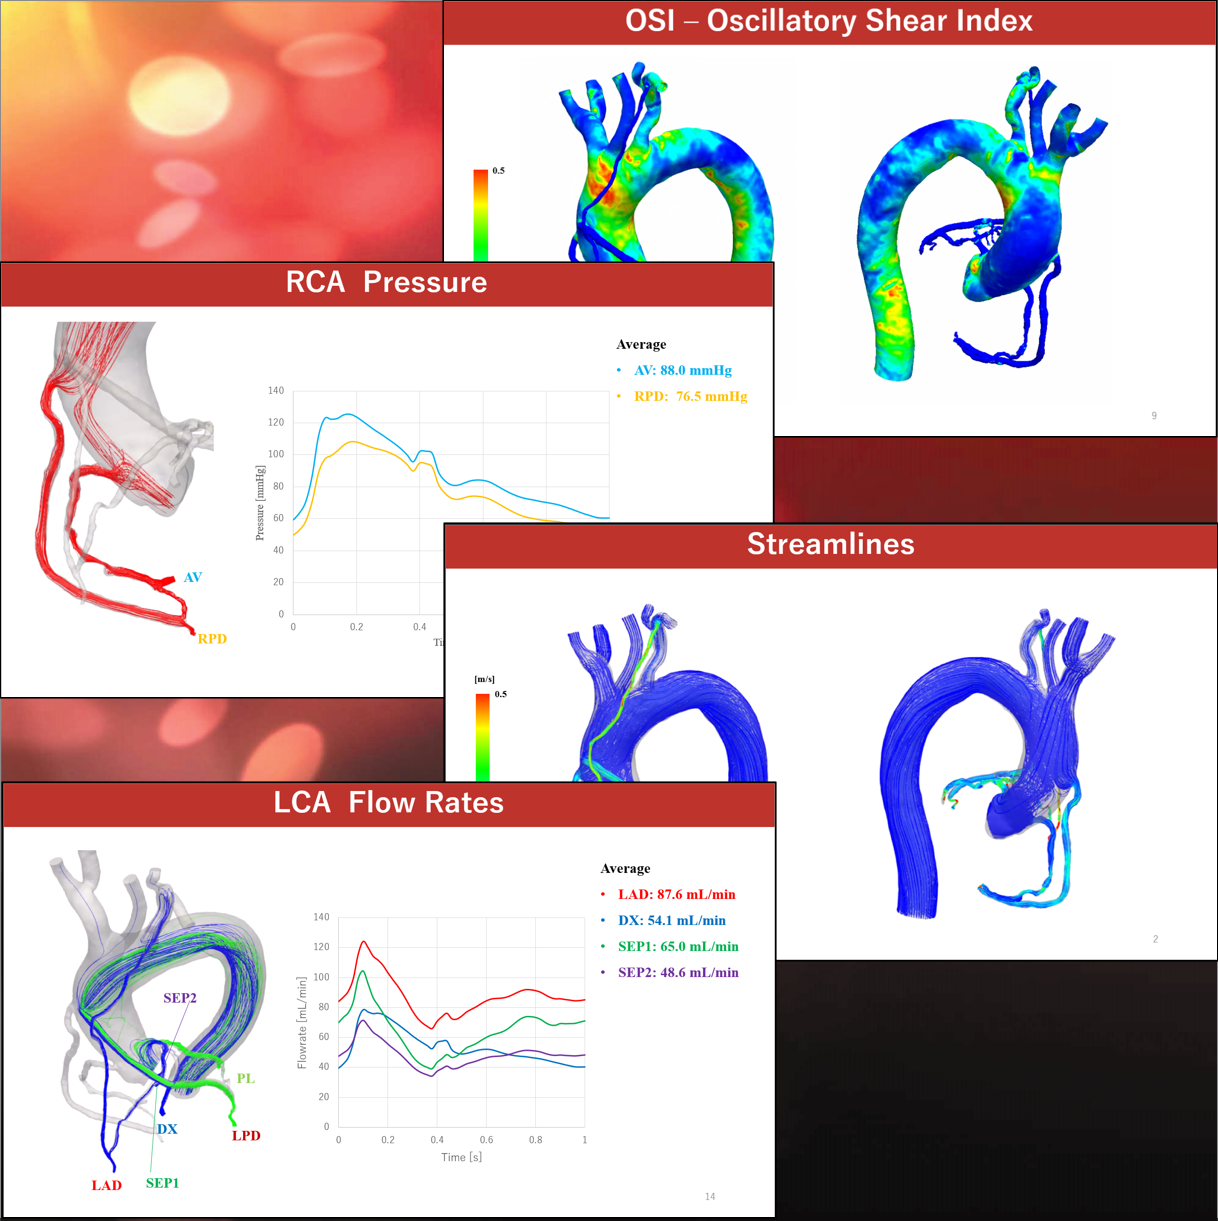
  • Step4: Reporting service
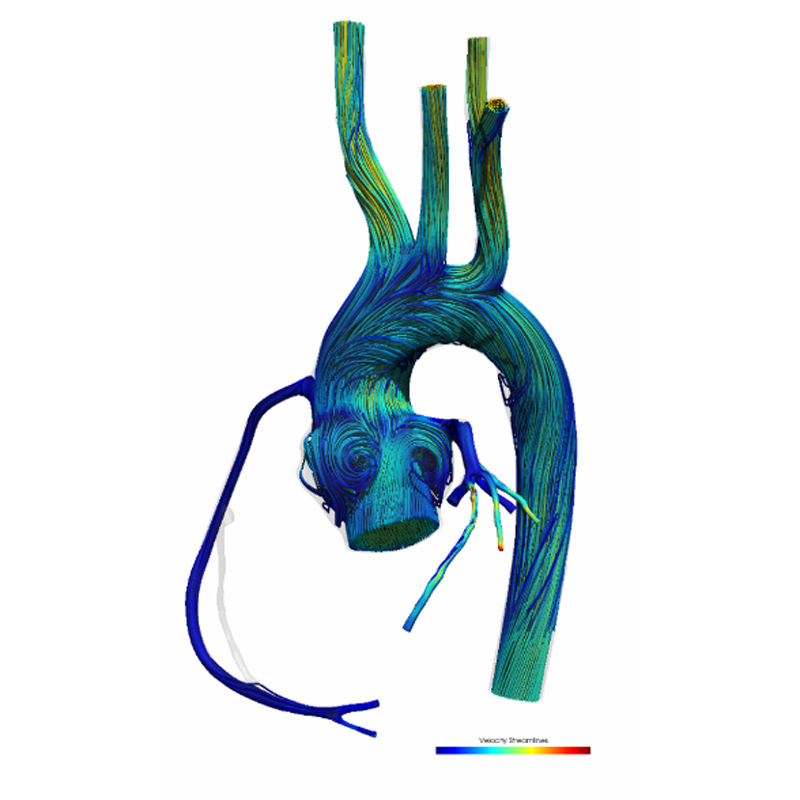
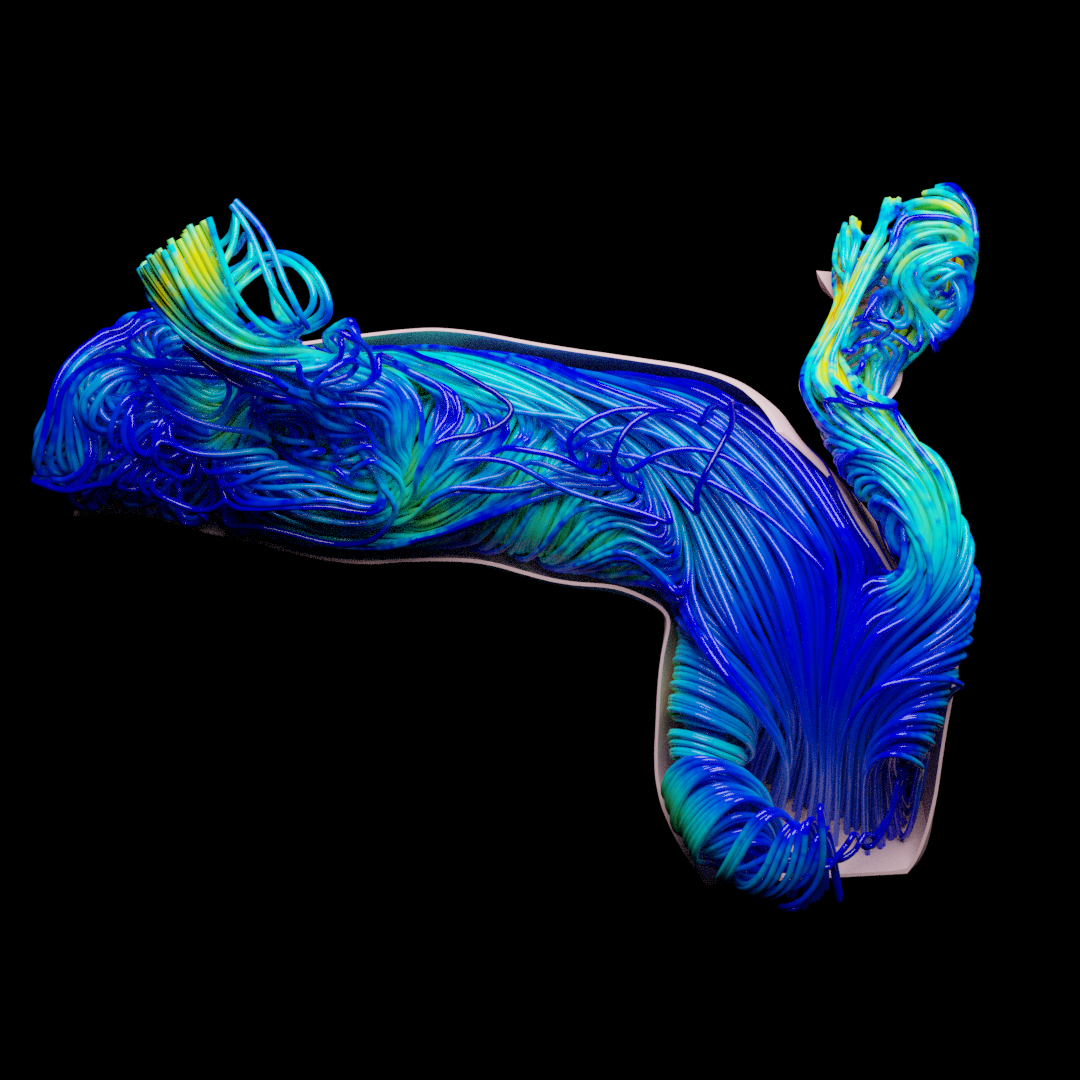
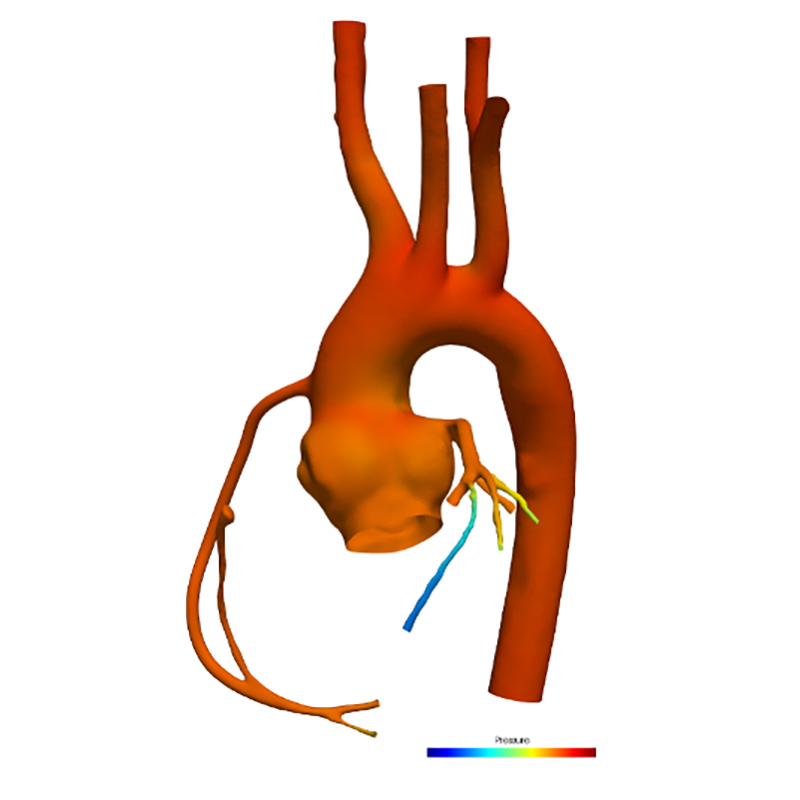
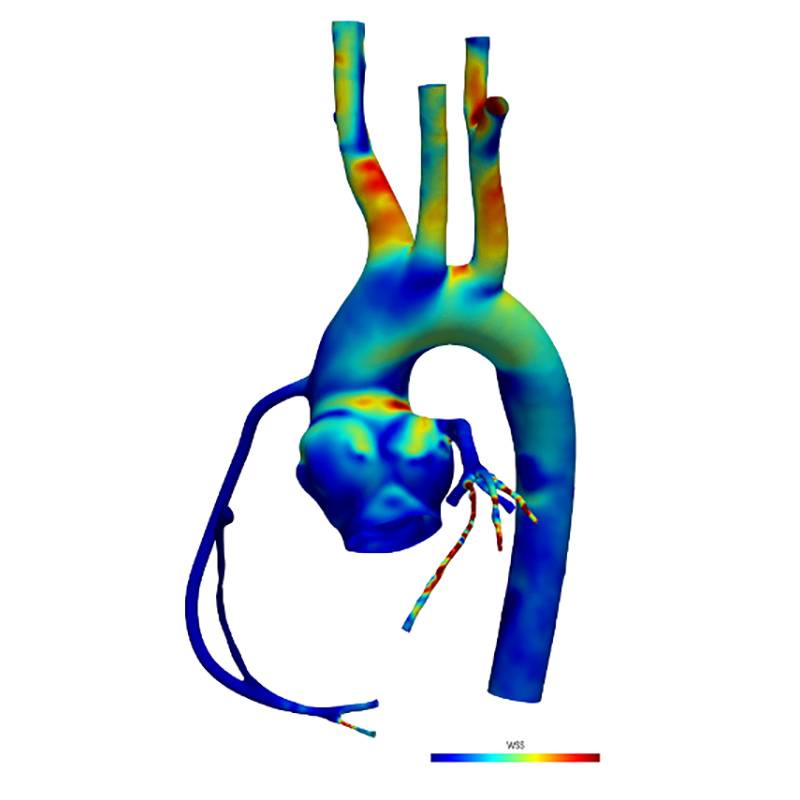
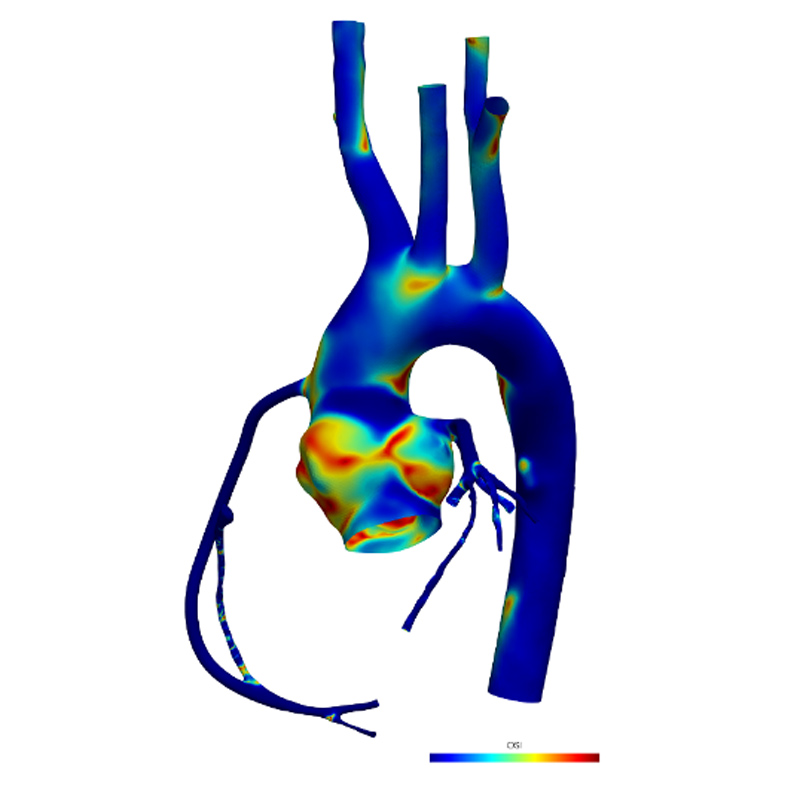
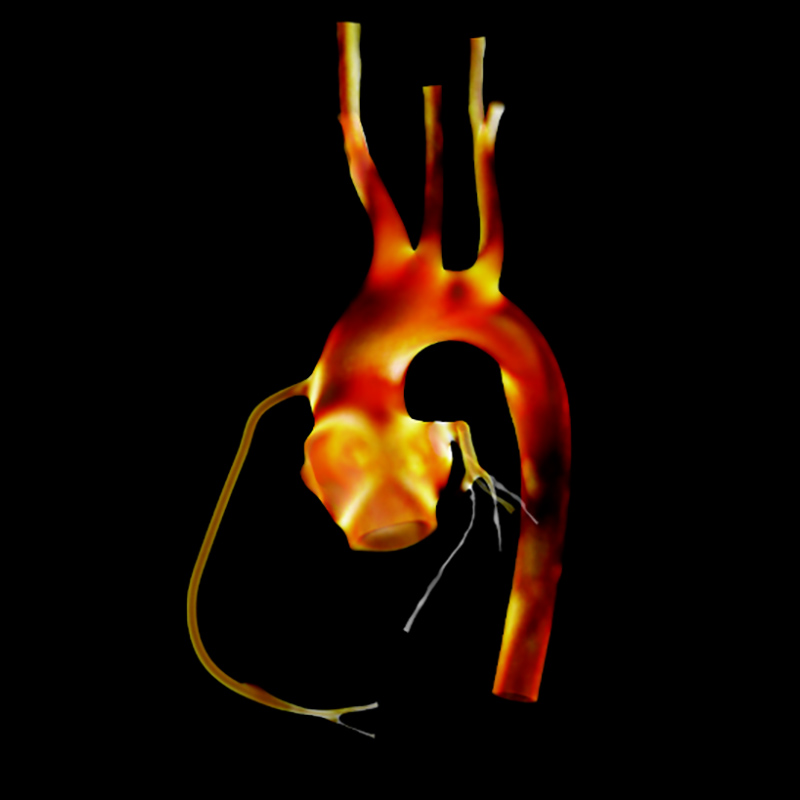
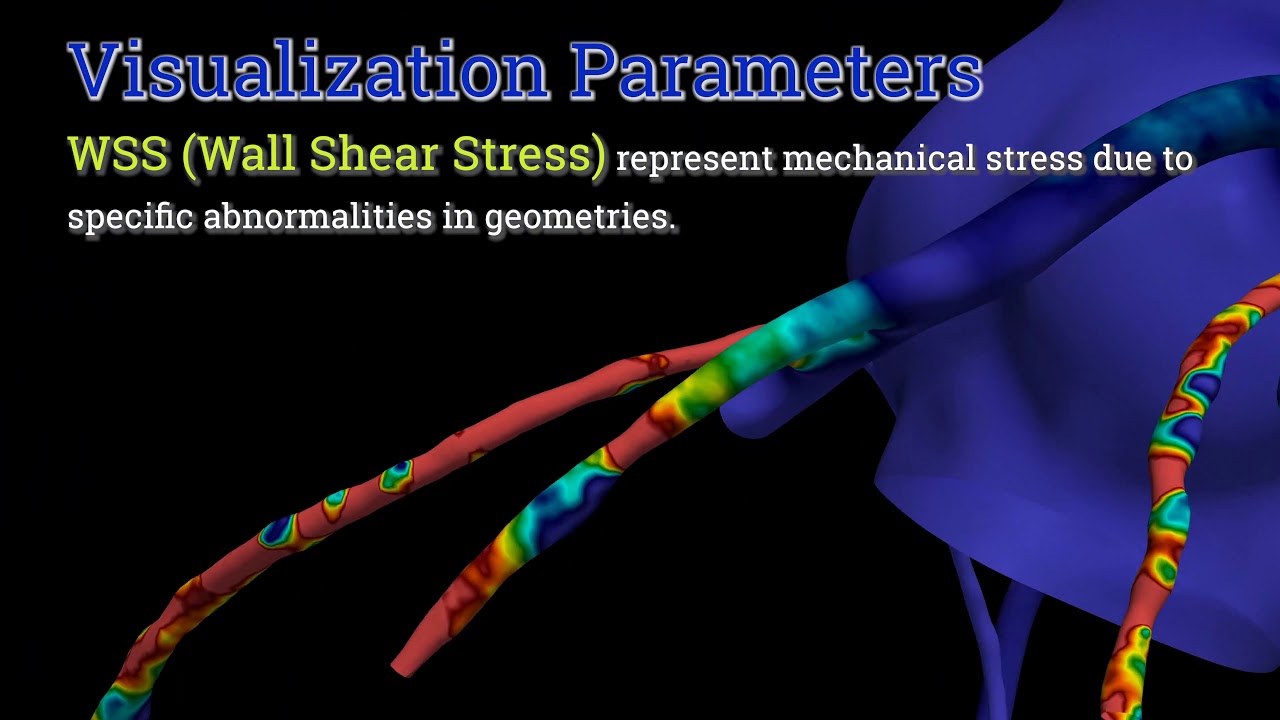
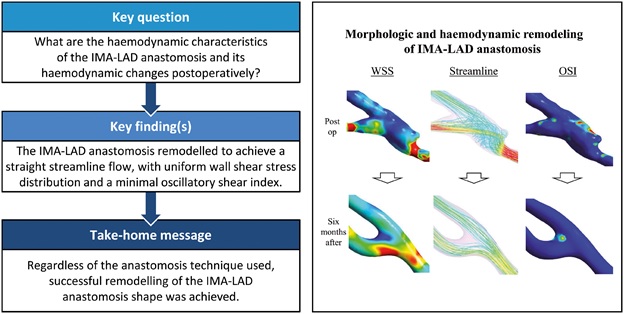
    From the calculated results, iTSimulation can provide any information that researchers/clients require, including 3D flow streamlines and pathlines, pressure distribution, wall shear stress (WSS), oscillatory shear index (OSI) distribution, flow rate of vessel branches and energy loss. We generally send a report (format is pptx) with videos, figures, and graphs produced from the simulation. We also provide results in ParaVIEW supported data format on request from the researchers/clients which enables them to visualize and investigate the results in space and time by themselves.

Features of iTSimulation

  • Reliable Simulation System
    Reliable calculation system
    Cardio Flow Design Inc. has developed in-house codes based on OpenFOAM CFD finite volume solver, that realizes physiological pulsatile flow in cardiovascular system. The system is fully validated with accumulated data of clinical and basic research results/publications.
  • Focus supercomputer
    High-precision analysis using the FOCUS supercomputer system
                       
    At Cardio Flow Design, supercomputer (FOCUS) is used for large scale computation. It enables the analysis of complex anatomy cases and medical devices with complex structure that are difficult to analyze in personal computers.
  • Report with visualized materials
    The produced results (videos, images, figures, plots, etc.) are compiled in Microsoft PowerPoint. We produce various snapshots/animations as requested. Some examples are shown below.

Visualized Parameters

  • Streamlines
    Streamline(Aorta)
    Streamlines are lines representing the direction of blood flow with flow acceleration or deceleration. The structure of vortex flow or flow collision can be visualized.
  • Streamlines
    Streamline(Patch)
  • Pressure
    Pressure
    Pressure contour can be visualized along the lining of the geometry wall.
  • Wall shear stress
    Wall shear stress
    Wall shear stress (WSS) contour can be visualized on the endothelial tissue to account for information about the mechanical stress due to specific abnormalities in geometries.
  • OSI
    Oscillatory shear index (OSI)
    Oscillatory shear index (OSI) is the temporal fluctuation of low and high average shear stress. OSI index response is a useful identifier for presence of plaques and other abnormalities.
  • Energy loss
    Flow energy loss
    Flow energy loss can be visualized and is useful for providing information regarding the cardiac workload.
  • Special requirements
    Special requirements
    Additional requirements such as Fractional Flow Reserve (FFR) calculations, Vorticity, 2D Vector Maps, etc. can be met as desired. As an example, an FFR calculation in the peak systolic phase has been visualized on the left.

Support

We also provide support for writing the “Method” section of your paper if required. Please contact us about it.

Experiences

Cardio Flow Design has provided iTSimulation service since 2015 in many areas. Some of these areas are:
  • Norwood Procedure
  • Fontan Procedure
  • Coronary Arteries
  • Coronary Artery Bypass Grafting (CABG)
  • Ventricular Septal Defect /Two Patch Technique
  • Aorta including Thoracic Aorta
  • Aorta including Abdominal Aorta
  • Total Anomalous Pulmonary Venous Return (TAPVR)
  • Cerebral Arteries
  • Transcatheter Aortic Valve Implantation (TAVI)
  • Hepatic Veins
  • Microvascular Anastomosis
  • Brachiocephalic Artery Pumping
  • Lung Trachea
  • Axillary-Knee Artery Bypass

Movies

Price

We have an academic option. Please contact us when you would like to check if your data can be computed or not.          
*Our software and/or service are not medical device. Thus, it's for research purpose only.        

Case Report

FAQs

  • I’d like to request an urgent analysis.
    Please contact us first. In some cases, we can deliver the product in a few days by trimming down the content of the analysis.
  • What is the cost of the simulation?
    It depends on the contents of the case and analysis.
    The price for companies in general is about $3,500 for small-scale analysis and about $7,500 for complex analysis.
    Prices for university researchers range from $800to $3,500.
  • Can I get a discount?
    Basically, we only sell software and contracted analysis at a fixed price, but depending on the analysis, we may be able to offer a discount by reducing man-hours, so please contact us first.
More Questions

Contact

If you would like to order or have any questions,
please let us know from the following contact form
Contact us